Showing posts with label cisco. Show all posts

Sunday, September 18, 2016

Cisco - Upgrade Switches From Tar (Bin+Html)

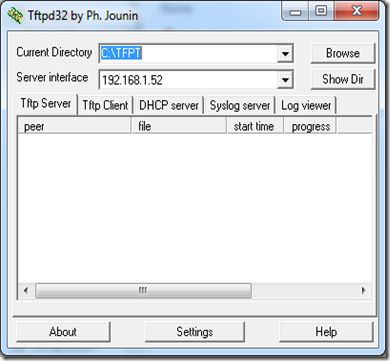
To upgrade a Cisco Switch from a .tar (IOS and Html - Management Web Page), just start TFTP64:

image

and use the command:

  • archive download-sw xxxxxxxxxx

on the switch command line, this will download and install the .tar, and set it to boot next time.

I normally use is the my “Main Command” this should work in most cases, but you have other options like the ones shown in “Command Options”, that you can use “as is”, or by combining them like the “Main Command”.


Main Command

Download & Install - Overwrite & Different Feauture Set
============================================
Download from TFTP server and unpack tar
and install it (IOS and Html - Management Web Page)
even if the current and the new image have diferent
feature sets (ex: ipbase vs ipservices)

archive download-sw /overwrite /allow-feature-upgrade tftp://192.168.1.230/c3560-ipservicesk9-tar.150-2.SE.tar

OPTIONS USED
/allow-feature-upgrade - update/downgrade to
                                    different feature set
                         
/overwrite                   - overwrite everything in
                                    the flash with the new
                                    IOS tar image


Command Options

Download & Install
============================================
Download from TFTP server and unpack tar and
install it (IOS and Html - Management Web Page)

archive download-sw tftp://192.168.1.230/c3560-ipservicesk9-tar.150-2.SE.tar


Download & Install - Overwrite
============================================
Download from TFTP server and unpack tar and
install it (IOS and Html - Management Web Page)
and overwrite everything in the flash with the
new downloaded IOS tar image

archive download-sw /overwrite tftp://192.168.1.230/c3560-ipservicesk9-tar.150-2.SE.tar

 OPTIONS USED
/overwrite - overwrite everything in the flash
                    with the new IOS tar image

 
Download & Install - Different Feauture Set
============================================
Download from TFTP server and unpack tar
and install it (IOS and Html - Management Web Page)
even if the current and the new image have diferent
feature sets (ex: ipbase vs ipservices)

archive download-sw /allow-feature-upgrade tftp://192.168.1.230/c3560-ipservicesk9-tar.150-2.SE.tar

OPTIONS USED
/allow-feature-upgrade - update/downgrade to different feature set


Download & Install - Image Only
============================================
Download from TFTP server and unpack tar
and install it only the IOS (.bin) and deletes
the Html files (Management Web Page)

archive download-sw /imageonly  tftp://192.168.1.230/c3560-ipservicesk9-tar.150-2.SE.tar

 OPTIONS USED
 /imageonly - Install only the IOS (.bin) image and
                      delete the Html files (Management Web Page)
 
 
Download & Install - Safe
============================================
Download from TFTP server and unpack tar
and install it (IOS and Html - Management Web Page).

Waits for new IOS to be downloaded successfully
before deleting the old IOS

archive download-sw /safe tftp://192.168.1.230/c3560-ipservicesk9-tar.150-2.SE.tar

OPTIONS USED
/safe - waits for the new IOS to be downloaded
           successfully before deleting the old IOS
        

Base On: https://cyruslab.net/2012/06/03/maintenance-ios-upgradedowngrade-with-archive-download-sw-command/

Monday, November 23, 2015

Cisco - Linux Commands on IOS


Today we’re going to go over a little known shell in IOS that gives us some bash like functionality! It is called IOS.sh

We can enable this little known functionality with the terminal shell command, like the rest of the terminal commands this only enables IOS.sh for the current terminal session.

R1#terminal shell

If you want to have the shell enabled permanently with the following global command

R1(config)#shell processing full

R1#show terminal | in Shell
Shell: enabled
Shell trace: off

Now IOS.sh is enabled! Awesome! But what does it do?
The simple answer is it makes IOS more like a Linux shell, it allows us to create variables, make loops, and use some linux utilities like grep or wc on the shell.


Using GREP

One of the neatest features of IOS.sh is the ability to use the grep utility to filter output. Let’s start by looking at the manpage for Grep, yes there are manpages!

R1#man grep
NAME
grep - get regular expression

SYNOPSIS
    grep [OPTIONS] <Regular Expression> [<file>...]

DESCRIPTION
    The 'grep' command matches lines in the given files
    with the supplied regular expression, and prints matching
    lines. There are lots of options
   
    -b              - match everything in a file after pattern
    -c              - print a count of lines instead of matched lines
    -e <pat>    - use &lt;pat&gt; as the pattern (it may have a leading minus)
    -h             - do not print filename for each match (default)
    -H             - print filename for each match
    -i              - ignore case
    -l              - print only files with match
    -L             - print only files without match
    -m            - match everything in a matching mode
    -n             - print line numbers along with matches
    -q             - quiet, only set status
    -s             - supress printing errors
    -u             - match everything in a file until pattern
    -v             - invert match, print non-matching lines

Part of the power of this command is because you can be more flexible than the standard include pipe command because you can do things like combine include and exclude like statements in the same line.

R1#show ip route | grep (150) | grep (10003)    
O        150.1.2.2 [110/10003] via 155.1.146.4, 15:51:41, GigabitEthernet1.146
O        150.1.3.3 [110/10003] via 155.1.146.4, 15:51:41, GigabitEthernet1.146
O IA     150.1.22.22 [110/10003] via 155.1.146.4, 1d11h, GigabitEthernet1.146

R1#show ip route | grep (150) | grep -v (10003)
      150.1.0.0/32 is subnetted, 11 subnets
C        150.1.1.1 is directly connected, Loopback0
O        150.1.4.4 [110/2] via 155.1.146.4, 15:51:57, GigabitEthernet1.146
O        150.1.5.5 [110/3] via 155.1.146.4, 15:51:57, GigabitEthernet1.146
O        150.1.6.6 [110/2] via 155.1.146.6, 1d12h, GigabitEthernet1.146
O IA     150.1.7.7 [110/3] via 155.1.146.6, 1d12h, GigabitEthernet1.146
O IA     150.1.8.8 [110/4] via 155.1.146.4, 15:52:07, GigabitEthernet1.146
O IA     150.1.9.9 [110/4] via 155.1.146.6, 1d12h, GigabitEthernet1.146
O IA     150.1.10.10 [110/5] via 155.1.146.4, 15:52:07, GigabitEthernet1.146

R1#show ip route | grep 150 | grep -v 10003 | grep 6\.6
O 150.1.6.6 [110/2] via 155.1.146.6, 00:35:18, GigabitEthernet1.146
O IA 150.1.7.7 [110/3] via 155.1.146.6, 00:35:08, GigabitEthernet1.146
O IA 150.1.9.9 [110/4] via 155.1.146.6, 00:35:08, GigabitEthernet1.146


WC

WC can be used to count the number of things in the output.

R1#man wc
NAME
    wc

SYNOPSIS
    wc [OPTION]... [FILE]...

DESCRIPTION
    Print newline, word, and byte counts for each FILE, and a total line if
    more than one FILE is specified. Read pipe input if no files are given
    -c print the byte counts
    -m print the character counts
    -l print the newline counts
    -L print the length of the longest line
    -w print the word counts

R1#show run | wc -l
216


Heads and Tails

These commands can be used to show the top x or bottom x lines of output, this can be handy with trying to see the latest logs.

R1#man head
NAME
    head - print the first lines in the input

SYNOPSIS
    head [<n>]

DESCRIPTION
    The 'head' program will print the first lines in
    its input. If given a numeric argument, it will
    print that many lines. The default number of lines
    is 10.


R1#man tail
NAME
    tail - print the last lines in the input

SYNOPSIS
    tail [<n>]

DESCRIPTION
    The 'tail' program will print the last lines
    in its input. If given a numeric argument, it
    will print that many lines. The default number
    of lines is 10.
    R1#

R1#show run | head 10
Building configuration...

Current configuration : 2844 bytes
!
! Last configuration change at 18:14:38 UTC Tue Nov 17 2015
!
version 15.5
no service timestamps debug uptime
no service timestamps log uptime
no platform punt-keepalive disable-kernel-core

R1#show run | tail 10
exec-timeout 0 0
privilege level 15
logging synchronous
stopbits 1
line vty 0 4
privilege level 15
no login
!
!
end


CAT

Ok fine, we can use the cat command to view text files on the Cisco device.

R1#man cat
NAME
    cat - write files or standard input to output

SYNOPSIS
    cat [<file>...]

DESCRIPTION
    The cat command writes whatever it sees to its output

    R1#copy running-config flash:cat.test
    Destination filename [cat.test]?
    2844 bytes copied in 0.463 secs (6143 bytes/sec)


R1#cat flash:cat.test
!
! Last configuration change at 18:14:38 UTC Tue Nov 17 2015
!
version 15.5
no service timestamps debug uptime
no service timestamps log uptime
no platform punt-keepalive disable-kernel-core
platform console serial


Variables

Lets start with making variables by first looking at the variables

R1#man variables
NAME
    variables - describe the usage of variables

DESCRIPTION
    Variables can be used in any context except single quotes. Variables
    can either be named, or numbered parameters to functions. Setting a
    named variable can be accomplished using an assignment statement.
    Assignment statments have a specific form, which is that the name of
    the variable must be immediately followed by an '=' sign. There can be
    no whitespace between the name and the '=':

    router> MYVAR='abc'

    The right side of the assignment is any string, but can also be the
    result of execution of a backquote expression, or the evaluation of a
    variable expansion.

    Variables may be used anywhere in subsequent input lines. One could,
    for example, create a shortcut for an interface name, and use it in
    config mode, or create a variable containing a number, and increment
    its value using arithmetic expression syntax (see man expressions).

    The main issue here is that the variable introduction character may
    conflict with existing usages, and so must be escaped in situations
    where a compatibility issue may arise. Please see man compatibility
    for more information.

To make a variable you simply have to enter VariableName=VariableValue

R1#VAR1=Value1
R1#VAR2=Value2

We can view the contents with the echo command

R1#echo $VAR1 $VAR2
Value1 Value2

You can also use variables in your commands

R2#var1=150.1.4.4

R2#ping $var1
Type escape sequence to abort.
Sending 5, 100-byte ICMP Echos to 150.1.4.4, timeout is 2 seconds:
!!!!!
Success rate is 100 percent (5/5), round-trip min/avg/max = 71/100/167 ms


Conditions and Loops

Following comparison operators can be used for working with integer values:
Operators   Characteristics
-eq               ==
-ne               !=
-lt                 <
-gt                >
-ge               >=
-le                =<

For working with files following conditions are available:

Operator    Characteristics
-a  or –e      True if file exists
-d               True if file exist and it is a directory
-f                True if file exists and is a regular file
-r                True if file exists and is readable
-s               True if file exists and has a size greater than zero
-w               True if file exists and is executable
-nt              Test if file1 is newer than file2. The modification date on the file is used for this comparison
-ot              Test if file1 is older than file2

Loops are very powerful (and dangerous if you don’t terminate them correctly) tools that allow you to carry out complex tasks.

R1#for x in 1 2 3 4 5 6 7 8 9
do..done>do
do..done>;ping 150.1.$x.$x
do..done>done

Type escape sequence to abort.
Sending 5, 100-byte ICMP Echos to 150.1.1.1, timeout is 2 seconds:
!!!!!
Success rate is 100 percent (5/5), round-trip min/avg/max = 5/13/39 ms
Type escape sequence to abort.
Sending 5, 100-byte ICMP Echos to 150.1.2.2, timeout is 2 seconds:
!!!!!
Success rate is 100 percent (5/5), round-trip min/avg/max = 64/140/228 ms
Type escape sequence to abort.
Sending 5, 100-byte ICMP Echos to 150.1.3.3, timeout is 2 seconds:
!!!!!
Success rate is 100 percent (5/5), round-trip min/avg/max = 52/91/186 ms
Type escape sequence to abort.
Sending 5, 100-byte ICMP Echos to 150.1.4.4, timeout is 2 seconds:
!!!!!
Success rate is 100 percent (5/5), round-trip min/avg/max = 31/61/117 ms
Type escape sequence to abort.
Sending 5, 100-byte ICMP Echos to 150.1.5.5, timeout is 2 seconds:
!!!!!
Success rate is 100 percent (5/5), round-trip min/avg/max = 42/73/117 ms
Type escape sequence to abort.
Sending 5, 100-byte ICMP Echos to 150.1.6.6, timeout is 2 seconds:
!!!!!
Success rate is 100 percent (5/5), round-trip min/avg/max = 34/51/93 ms
Type escape sequence to abort.
Sending 5, 100-byte ICMP Echos to 150.1.7.7, timeout is 2 seconds:
!!!!!
Success rate is 100 percent (5/5), round-trip min/avg/max = 53/73/97 ms
Type escape sequence to abort.
Sending 5, 100-byte ICMP Echos to 150.1.8.8, timeout is 2 seconds:
!!!!!
Success rate is 100 percent (5/5), round-trip min/avg/max = 67/98/116 ms
Type escape sequence to abort.
Sending 5, 100-byte ICMP Echos to 150.1.9.9, timeout is 2 seconds:
!!!!!
Success rate is 100 percent (5/5), round-trip min/avg/max = 78/98/122 ms


Functions

Lastly for this blog entry, you can define functions to make repeated tasks easier.

R1#function test-r1() {
{..} >ping 150.1.4.4
{..} >}
R1#

R4#test-r1
Type escape sequence to abort.
Sending 5, 100-byte ICMP Echos to 150.1.5.5, timeout is 2 seconds:
!!!!!
Success rate is 100 percent (5/5), round-trip min/avg/max = 26/39/63 ms


You can see the functions defined on the system with show shell function

R4#show shell functions
User defined functions:

Function namespace: DEFAULT
    R1#function test-r1()
    {
     ping 150.1.5.5
    }


Taken From:

Sunday, November 1, 2015

Cisco - Port Mirror (SPAN / RSPAN / ERSPAN)

Introduction:

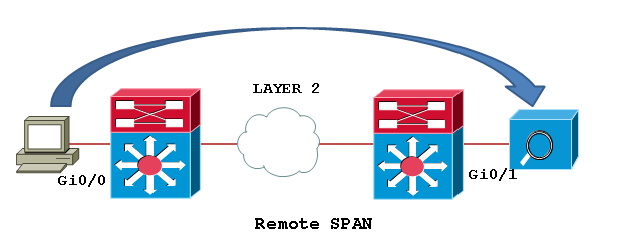
Switch port Analyzer (SPAN) is an efficient, high performance traffic monitoring system. It duplicated network traffic to one or more monitor interfaces as it transverse the switch. SPAN is used for troubleshooting connectivity issues and calculating network utilization and performance, among many others. There are three types of SPANs supported on Cisco products, which are illustrated in below diagram.

Types of SPAN:

SPAN1.jpgSPAN2.pngSPAN3.jpg

SPAN

SPAN1.jpg

Local SPAN: Mirrors traffic from one or more interface on the switch to one or more interfaces on the same switch.
Remote SPAN (RSPAN): An extension of SPAN called remote SPAN or RSPAN. RSPAN allows you to monitor traffic from source ports distributed over multiple switches, which means that you can centralize your network capture devices. RSPAN works by mirroring the traffic from the source ports of an RSPAN session onto a VLAN that is dedicated for the RSPAN session. This VLAN is then trunked to other switches, allowing the RSPAN session traffic to be transported across multiple switches. On the switch that contains the destination port for the session, traffic from the RSPAN session VLAN is simply mirrored out the destination port.
Encapsulated remote SPAN (ERSPAN): encapsulated Remote SPAN (ERSPAN), as the name says, brings generic routing encapsulation (GRE) for all captured traffic and allows it to be extended across Layer 3 domains.

ERSPAN is a Cisco proprietary feature and is available only to Catalyst 6500, 7600, Nexus, and ASR 1000 platforms to date. The ASR 1000 supports ERSPAN source (monitoring) only on Fast Ethernet, Gigabit Ethernet, and port-channel interfaces.

Configuration Example:
Configuring Local SPAN: Local SPAN configures using “monitor session” command specifying source and destination on the same switch.

Switch1# configure terminal
Switch1(config)# monitor session 1 source interface fastEthernet0/2
Switch1(config)# monitor session 1 destination interface fastEthernet0/24
Switch1(config)#end

Local SPAN configuration syntax on Cisco IOS release 12.2(33)SXH and beyond as shown below.

monitor session 1 type local
source int fa0/2
destination int fa0/24


RSPAN

SPAN2.png

Step1: In order to configure RSPAN you need to have an RSPAN VLAN, those VLANs have special properties and can’t be assigned to any access ports. To create a VLAN for RSPAN on Cisco IOS, you must create the VLAN via the config-vlan configuration mode, as opposed to using the older VLAN database configuration mode. During the process of defining VLAN parameters, you must specify that the new VLAN is an RSPAN VLAN by configuring the remote-span VLAN configuration command.

Switch1# configure terminal
Switch1(config)# vlan 200
Switch1(config-vlan)# remote-span
Switch1(config-vlan)# end
Switch1# show vlan remote-span

Switch2# configure terminal
Switch2(config)# vlan 200
Switch2(config-vlan)# remote-span
Switch2(config-vlan)# end
Switch2# show vlan remote-span
Remote SPAN VLANs

Step2: Then configure the RSPAN on Source switch: Unlike SPAN, where the source and destination ports exist on the same switch, the source and destination ports for an RSPAN session reside on different switches. This requires a separate RSPAN source session to be configured, as well as a separate RSPAN destination session to be configured.

Switch1# configure terminal
Switch1(config)# monitor session 1 source interface fastEthernet0/2 rx
Switch1(config)# monitor session 1 destination remote vlan 200
reflector-port fastEthernet0/24
Switch1(config)# exit

Switch1# show monitor
Session 1
---------
Type                 : Remote Source Session
Source Ports     :
   Rx                 : Fa0/2
Reflector Port    : Fa0/24
Dest RSPAN VLAN  : 200

Step3: Configure the RSPAN on destination switch:
Switch2# configure terminal
Switch2(config)# monitor session 1 source remote vlan 200
Switch2(config)# monitor session 1 destination interface fastEthernet0/3
Switch2(config)# exit

The RSPAN VLAN should be allowed in ALL trunks between the involved switches (Source and Destination switches in this case); if you have enabled "pruning" in your network, remove the RSPAN VLAN from the pruning, with the command: “switchport trunk pruning vlan remove <RSPAN VLAN ID>” under the interface configure as trunk.

ERSPAN

SPAN3.jpg

In this example we will capture received traffic on the ASR 1002 (GigabitEthernet0/1/0) and send to Catalyst 6509 Gig2/2/1. This traffic will simply be captured, encapsulated in GRE by ASR 1002 natively by the QFP chipset and routed over to the Catalyst 6509. A sniffing station on the 6500 attached to GE2/2/1 will see the complete Ethernet frame (L2 to L7) information.
Configuring source interface, direction of traffic, and ERSPAN session ID on the ASR 1002.

ASR1002(config)# monitor session 1 type erspan-source
ASR1002(config-mon-erspan-src)# source interface gig0/1/0 rx
ASR1002(config-mon-erspan-src)# no shutdown
ASR1002(config-mon-erspan-src)# destination
ASR1002(config-mon-erspan-src-dst)# erspan-id 101
ASR1002(config-mon-erspan-src-dst)# ip address 10.1.1.1
ASR1002(config-mon-erspan-src-dst)# origin ip address 172.16.1.1

Configuring Catalyst 6509 to receive traffic from the source session on the ASR 1002

SW6509(config)# monitor session 2 type erspan-destination
SW6509(config-mon-erspan-dst)# destination interface gigabitEthernet2/2/1
SW6509(config-mon-erspan-dst)# no shutdown
SW6509(config-mon-erspan-dst)# source
SW6509(config-mon-erspan-dst-src)# erspan-id 101
SW6509(config-mon-erspan-dst-src)# ip address 10.1.1.1

You can use the show monitor session command to verify the configuration:

ASR1002#sh monitor session 1
Session 1
---------
Type                             : ERSPAN Source Session
Status                           : Admin Enabled
Source Ports                  :
RX Only                         : Gi0/1/0
Destination IP Address   : 10.1.1.1
MTU                              : 1464
Destination ERSPAN ID  : 101
Origin IP Address           : 172.16.1.1

To monitor the statistics of monitored traffic, you need to use "show platform hardware qfp active feature erspan state" command:

ASR1002#show platform hardware qfp active feature erspan state
ERSPAN State:
Status                : Active
Complexes         : 1
CPPs                 : 1
Capabilites          :
Max sessions      : 1024
Max outputs        : 128
Encaps type        : ERSPAN type-II
GRE protocol       : 0x88BE
MTU                    : 1464
IP TOS                : 0
IP TTL                 : 255
COS                   : 0
System Statistics:
DROP src session replica :                  0 /                 0
DROP term session replica:                 0 /                 0
DROP receive malformed   :                 0 /                 0
DROP receive invalid ID  :                    0 /                 0
DROP recycle queue full  :                   0 /                 0
DROP no GPM memory       :               0 /                 0
DROP no channel memory   :               0 /                 0
Client Debug Config:
Enabled: Info, Warn
Data Path Debug Config:
0x00000000
ASR1002#

Note:  10.1.1.1 is SW6509’s loopback. 172.16.1.1 Is ASR1002's loopback. ip address in destination session and ip address in source session should match. If they don't- that is causing the drops you see.

Taken From:

Sunday, October 18, 2015

Cisco - Dual WAN Internet with Failover (NAT & Routes)

In the past I had the need to implement failover between two connections to the Internet on the same router, at the time I implemented it using EEM Scripts which wasn’t the most elegant solution, so here I’m going to show you a  a better solution to do this.

Implementing the failover mechanism at first glance seems easier with one router than with two, but that is not the case, with two routers you can have them configured normally with the adition of VRRP/HSRP to do the failover between the routers.

With only one router you are going to have two aditional problems:

  • Changing the route from the primary to the secondary Internet access
  • Changing the NAT overload to the Interface towards the Secondary ISP / WAN (this was the part that I implemented with EEM scripts)

the first you can easily solve with a floating static route (secondary route) and a track / ip sla (to remove the primary route when the connectivity to the primary ISP is lost).

The second one is harder, you can have two NAT rules with two interfaces towards the two ISPs:

ip nat inside source 130 interface FastEthernet0/0 overload
ip nat inside source 131 interface FastEthernet1/0 overload

but selecting the one as the active one is the tricky part.

Even if the interface towards the primary ISP were to fail and become shutdown, the NAT rule remains active.

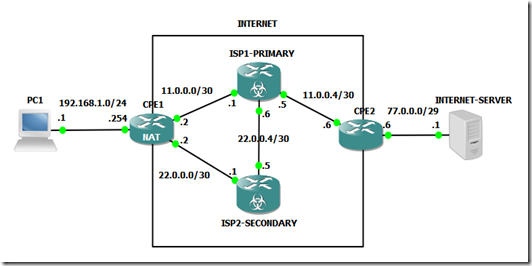
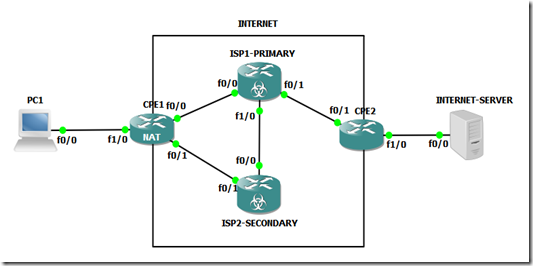
The cenario bellow has two different ISPs for for the WAN accesses, but its the sames as having two different connectivities via the same ISP (eg. Primary via Fiber Optic | Secondary via 4G)

Cenario

Logical View

TOP17

Fisical View

TOP18

You can download the lab fully implemented here:

it was implemented on GNS3 v1.2.1.


Configuration


PC1
====================================================

enable
conf t

hostname PC1

interface FastEthernet0/0
description *** Link to CPE1 ***
ip address 192.168.1.1 255.255.255.0
no shutdown

ip route 0.0.0.0 0.0.0.0 192.168.1.254 name DefaultGW
 
do write
 
 
CPE1
====================================================

enable
conf t

hostname CPE1

interface FastEthernet0/0
description *** Link to ISP1 ***
ip address 11.0.0.2 255.255.255.252
ip nat outside
no shutdown
 
interface FastEthernet0/1
description *** Link to ISP2 ***
ip address 22.0.0.2 255.255.255.252
ip nat outside
no shutdown
 
interface FastEthernet1/0
no switchport
description *** Link to PC1 ***
ip address 192.168.1.254 255.255.255.0
ip nat inside
no shutdown

 
!-- Select the Route - via ISP1 or ISP2 -------------------
!!!!!!!!!!!!!!!!!!!!!!!!!!!!!!!!!!!!!!!!!!!!!!!!!!!!!!!!!!!!!!!!!!!!!!!!!!!!!!!!!!!!!!!!!!!!!!!!
! The first route makes all the traffic flow via
! ISP1, but this is conditioned to track 10, that
! detects the  connectivity to ISP1.
! If track 10 fails the route is removed from the
! routing table.
!
!
! The second route has an higher administrative
! distance (worst), and as long as the first rule
! is available this rule is never inserted on
! the routing table (aka floating static route)
!
! If the first route disapears because the track
! failed then the second route is inserted in the
! routing table, and all traffic will flow via ISP2
!!!!!!!!!!!!!!!!!!!!!!!!!!!!!!!!!!!!!!!!!!!!!!!!!!!!!!!!!!!!!!!!!!!!!!!!!!!!!!!!!!!!!!!!!!!!!!!!

ip route 0.0.0.0 0.0.0.0 11.0.0.1 track 10 name Default-Primary
ip route 0.0.0.0 0.0.0.0 22.0.0.1 250 name Default-Secondary

ip sla 10
icmp-echo 11.0.0.1 source-interface FastEthernet0/0
frequency 5
ip sla schedule 10 life forever start-time now

track 10 ip sla 10 reachability
!show track brief
!show track 10


!-- Change the NAT Interface to Reflect the Active Route --
!!!!!!!!!!!!!!!!!!!!!!!!!!!!!!!!!!!!!!!!!!!!!!!!!!!!!!!!!!!!!!!!!!!!!!!!!!!!!!!!!!!!!!!!!!!!!!!!
! Changing the routes isn't enough, we also
! need to change the NAT rule, because each route
! implies a different exit interface.
!
! To select which NAT rule will be used for each
! route, we used route maps instead of an ACL
! to identify traffic (active the rule).
!
! These route maps match the LAN traffic, plus
! the current next hop to forward the traffic thus
! selecting the correct NAT rule for the current
! active route.
!!!!!!!!!!!!!!!!!!!!!!!!!!!!!!!!!!!!!!!!!!!!!!!!!!!!!!!!!!!!!!!!!!!!!!!!!!!!!!!!!!!!!!!!!!!!!!!!

ip nat inside source route-map RM-ISP1-PRIMARY interface FastEthernet0/0 overload
ip nat inside source route-map RM-ISP2-PRIMARY interface FastEthernet0/1 overload


access-list 130 remark *** Traffic for The Internet (NAT) ***
access-list 130 permit ip 192.168.1.0 0.0.0.255 any

route-map RM-ISP1-PRIMARY permit 10
match ip address 130
match interface FastEthernet0/0        !--> Match the exit interface of the route

route-map RM-ISP2-PRIMARY permit 10
match ip address 130
match interface FastEthernet0/1        !--> Match the exit interface of the route
!show route-map


!-- Simulate a Failure Along The Way ----------------------
!!!!!!!!!!!!!!!!!!!!!!!!!!!!!!!!!!!!!!!!!!!!!!!!!!!!!!!!!!!!!!!!!!!!!!!!!!!!!!!!!!!!!!!!!!!!!!!!
! To simulate the failure to see the topology
! changing to the secondary access, we are going
! to use a route to force the track/ip sla to fail.
!
! This route will force all the connectivity test
! traffic destined for ISP1(11.0.0.1) to go to NULL
! which is a black hole. Like this ISP1 will never
! get the icmp echos requests from the ip sla test
! or respond to it, thus simulating a connectivity
! failure towards ISP1
!
! NOTE: It takes a couple of seconds to change
!!!!!!!!!!!!!!!!!!!!!!!!!!!!!!!!!!!!!!!!!!!!!!!!!!!!!!!!!!!!!!!!!!!!!!!!!!!!!!!!!!!!!!!!!!!!!!!!

!-- Failure Sim + Debug/Tshoot --
do debug ip nat
ping 77.0.0.1
show ip route
!S*    0.0.0.0/0 [1/0] via 11.0.0.1

ip route 11.0.0.1 255.255.255.255 NULL0 name FailureSim

ping 77.0.0.1
show ip route
!S*    0.0.0.0/0 [250/0] via 22.0.0.1

! Both Pings will work but notice that the default
! route is diferent (diferent next hop)


!-- Restore to Normal Operation --
no ip route 11.0.0.1 255.255.255.255 NULL0 name FailureSim
do no debug all


ISP1-PRIMARY
====================================================

enable
conf t

hostname ISP1-PRIMARY

interface FastEthernet0/0
description *** Link to CPE1 ***
ip address 11.0.0.1 255.255.255.252
no shutdown

interface FastEthernet0/1
description *** Link to CPE2 ***
ip address 11.0.0.5 255.255.255.252
no shutdown
 
 
interface FastEthernet1/0
no switchport
description *** Link to ISP2 ***
ip address 22.0.0.6 255.255.255.252
no shutdown

    
ip route 77.0.0.0 255.255.255.248 11.0.0.6 name PublicIPs
ip route 22.0.0.0 255.255.255.252 22.0.0.5 name NatedLAN-viaIPS2

do write


ISP2-SECONDARY
====================================================

enable
conf t

hostname ISP2-SECONDARY

interface FastEthernet0/1
description *** Link to CPE1 ***
ip address 22.0.0.1 255.255.255.252
no shutdown
 
interface FastEthernet0/0
description *** Link to ISP1 ***
ip address 22.0.0.5 255.255.255.252
no shutdown

ip route 0.0.0.0 0.0.0.0 22.0.0.6 name Default
 
do write
 
 
CPE2
====================================================

enable
conf t

hostname CPE2

interface FastEthernet0/1
description *** Link to ISP1 ***
ip address 11.0.0.6 255.255.255.248
no shutdown
 
interface FastEthernet1/0
description *** Link to Internet Server ***
no switchport
ip address 77.0.0.6 255.255.255.248

ip route 0.0.0.0 0.0.0.0 11.0.0.5 name Default

do write


INTERNET SERVER
====================================================

enable
conf t

hostname INTERNET-SERVER

interface FastEthernet0/0
description *** Link to CPE1 ***
ip address 77.0.0.1 255.255.255.248
no shutdown
 
ip route 0.0.0.0 0.0.0.0 77.0.0.6 name Default

do write


Related Links

Wednesday, September 30, 2015

Cisco - EEM Scripts Examples (TSHOOT)

EEM is a very useful tool to troubleshoot occasional, sporadic CPU spikes that are short-lived and difficult to troubleshoot manually with the command line interface. This is an example of CPU spikes:

Switch#show process cpu history
<snip>
    11111822511   11 111277711111 124111  11 1211111112161116
    143342171209994090111878458239607111981270283361362429475
100
90
80      *               ***
70      *               ***                                *
60      *               ***                            *   *
50      *  *            ***        *                   *   *
40      *  *            ***        *                   *   *
30      * **            ***        *                   *   *
20      ****           **** **   ***         **  *  ** ** **
10 *********************************************************
   0....5....1....1....2....2....3....3....4....4....5....5....6....6....7.
             0    5    0    5    0    5    0    5    0    5    0    5    0
                   CPU% per hour (last 72 hours)
                  * = maximum CPU%   # = average CPU%

This section includes several examples of the use of EEM scripts to monitor CPU utilization. Catalyst 2960 and 3750 switches allow EEM to use non-volatile RAM (NVRAM); Catalyst 4500 switches allow EEM to write to bootflash; and Catalyst 6500 switches allow EEM to use disk0 and sup-bootdisk.

Email Alerts

This script emails an alert when CPU utilization goes above 50 percent. The body of the email is the output of theshow process cpu sorted command.
event manager applet highcpu
  event snmp oid 1.3.6.1.4.1.9.9.109.1.1.1.1.3.1 get-type exact entry-op ge
entry-val 50 poll-interval 0.5
action 1.0 cli command "enable"
  action 2.0 cli command "show proc cpu sorted"
  action 3.0 mail server "192.168.1.1" to "user-to@domain.com" from "user-from@domain.com"
subject "High CPU Alert" body "$_cli_result"

The definitions of italicized variables are:

  • highcpu - name of the event manager applet/script
  • 1.3.6.1.4.1.9.9.109.1.1.1.1.3.1 - Object identifier (OID) for polling the total CPU utilization of the route processor (RP)
  • 50 - CPU utilization that triggers the script
    poll-interval 0.5 - Frequency (every 0.5 seconds) the script monitors the CPU
  • 192.169.1.1 - IP of the mail server

      Append Output to Local File

      This script appends required outputs to a file in the local file system. Replace file system with the appropriate file system on the switch.
      event manager scheduler script thread class default number 1 
      event manager applet High_CPU
      event snmp oid 1.3.6.1.4.1.9.9.109.1.1.1.1.3.1 get-type exact entry-op ge
      entry-val 50 poll-interval 0.5
      action 0.0 syslog msg "High CPU DETECTED. Please wait - logging Information
      to file system:high_cpu.txt"
      action 0.1 cli command "enable"
        action 0.2 cli command "show clock | append file system:high_cpu.txt"
        action 1.2 cli command "term length 0"
        action 1.3 cli command "show process cpu sorted | append file system:high_cpu.txt"
        action 1.4 cli command "show log | append file system:high_cpu.txt"
        action 1.5 cli command "show interfaces | append file system:high_cpu.txt"
        action 1.6 cli command "term length 24"

      Append Output to Local File and Remove Script

      This script appends the output of the show process cpu sorted command to a file in the local file system, then removes itself once completed. Replace file system with the appropriate file system on the switch.
      event manager scheduler script thread class default number 1 
      event manager applet High_CPU
      event snmp oid 1.3.6.1.4.1.9.9.109.1.1.1.1.3.1 get-type exact entry-op gt
      entry-val 50 poll-interval 0.5
      action 0.0 syslog msg "High CPU DETECTED. Please wait - logging Information
      to flash:high_cpu.txt"
        action 0.1 cli command "enable"
        action 0.2 cli command "term exec prompt timestamp"
        action 1.3 cli command "show process cpu sorted | append file system:high_cpu.txt"
        action 1.4 cli command "show process cpu sorted | append file system:high_cpu.txt"
        action 1.4 cli command "show process cpu sorted | append file system:high_cpu.txt"
        action 5.1 syslog msg "Finished logging information to file system:high_cpu.txt..."
        action 5.1 syslog msg "Self-removing applet from configuration..."
        action 5.2 cli command "term no exec prompt timestamp"
        action 9.1 cli command "configure terminal"
        action 9.2 cli command "no event manager applet High_CPU"
        action 9.3 cli command "end"

      Collect Output and Write to Local File

      This script uses a syslog-based trigger in order to run and collect required outputs and write those outputs to the local file system. Replace file system with the appropriate file system on the switch.
      process cpu threshold type total rising 70 interval 15 
      event manager applet DETECT_CPU
      event syslog pattern ".*SYS-1-CPURISINGTHRESHOLD.*"
      action 1 cli command "en"
      action 2 cli command "show clock | append file system:cpuinfo"
      action 3 cli command "show proc cpu sort | append file system:cpuinfo"
      action 4 cli command "show line | append file system:cpuinfo"

      Monitor CPU Utilization on Modular IOS

      The Cisco EEM can also be used to monitor CPU utilization on modular IOS. Because of the differences in how the CPU is monitored on modular IOS, you can use the Simple Network Management Protocol (SNMP) OID (1.3.6.1.4.1.9.9.109.1.1.1.1.3.1) in order to check CPU utilization by the IOS base process.

      This script uses the OID as a trigger and writes required outputs to the local file system. Replace file system with the appropriate file system on the switch.

      event manager scheduler script thread class default number 1
      event manager applet High_CPU
      event snmp oid 1.3.6.1.4.1.9.9.109.1.1.1.1.10.1  get-type exact entry-op ge
      entry-val 50 poll-interval 0.5
        action 0.0 syslog msg "High CPU DETECTED. Please wait - logging Information
      to file system:high_cpu.txt"
        action 0.1 cli command "enable"
        action 0.2 cli command "show clock | append file system:high_cpu.txt"
        action 1.2 cli command "term length 0"
        action 1.3 cli command "show process cpu sorted | append file system:high_cpu.txt"
        action 1.4 cli command "show log | append file system:high_cpu.txt"
        action 1.5 cli command "show interfaces | append file system:high_cpu.txt"
        action 1.6 cli command "term length 24"

      Remove Script

      Enter this command in order to remove an EEM script:
      Switch(config)#no event manager applet applet 
    • Based On: http://www.cisco.com/c/en/us/support/docs/switches/catalyst-6500-series-switches/116141-trouble-eem-scripts-00.html
      Contributed by Cisco Engineers: Shashank Singh and Saurav Lahiri

      Thursday, August 20, 2015

      Cisco - Router / Switch as an HTTP Server

      You can use your Cisco router / switch as a Web server, Cisco IOS routers have HTTP interface since IOS 11.2, in IOS 12.2(15)T it was enhanced with HTTP 1.1 Web server that offers Secure Socket Layer (SSL) Version 3.

      Let’s test it out, I actually did this on a switch (cisco 3560)


      First let’s check current root folder for the HTTP server, in order to get a reference to restore the HTTP root path later:

      DSw1#show ip http server status
      HTTP server status: Enabled
      HTTP server port: 80
      HTTP server authentication method: enable
      HTTP server access class: 0
      HTTP server base path: flash:/c3560-ipservicesk9-mz.150-1.SE/html
      HTTP server help root:
      Maximum number of concurrent server connections allowed: 16
      Server idle time-out: 180 seconds
      Server life time-out: 180 seconds
      Maximum number of requests allowed on a connection: 25
      HTTP server active session modules: ALL
      HTTP secure server capability: Present
      HTTP secure server status: Enabled
      HTTP secure server port: 443
      HTTP secure server ciphersuite: 3des-ede-cbc-sha des-cbc-sha rc4-128-md5 rc4-128-sha
      HTTP secure server client authentication: Disabled
      HTTP secure server trustpoint:
      HTTP secure server active session modules: ALL

      To transfer the web page we are going to use TFTP, for the server just run TFPT32 / TFTP64 in your computer, and point it to the folder where you have the web page you want to transfer to your router / switch.

      1

      On router / switch copy the web page from the TFTP server (your PC) to your router / switch:

      DSw1#copy tftp://192.168.1.52/index.html flash://index.html
      Destination filename [index.html]?
      Accessing tftp://192.168.1.52/index.html...
      Loading index.html from 192.168.1.52 (via Vlan99): !
      [OK - 15772 bytes]

       
      DSw1#show flash
      Directory of flash:/
           2  -rwx       15772   Mar 1 1993 00:26:36 +00:00  index.html
            3  -rwx          1276   Mar 1 1993 00:00:40 +00:00  vlan.dat
        363  drwx         256   Mar 1 1993 00:39:23 +00:00  c3560-ipservicesk9-mz.150-1.SE
        487  -rwx        4189   Mar 1 1993 00:19:41 +00:00  config.text

      Now in the golbal configuration mode lets enable the HTTP server, set the path to root folder of the HTTP server, and activate local authentication, and a local user and password (if you don’t already don’t have one)

      ip http server
      ip http path flash://
      ip http authentication local

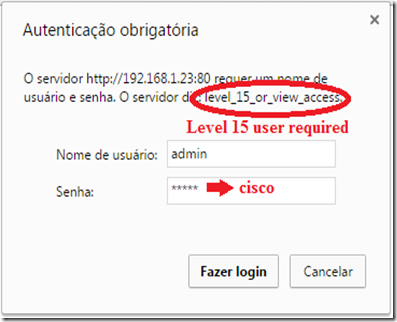
      username admin privilege 15 password 0 cisco  (the user level must be 15)

      you can also have HTTPS (secure) server using by adding the following command:

      ip http secure-server

      Here's a list of important commands you should know. These commands are in global configuration mode and have the format “ip http xxxxx”.

      • access-class: This restricts access to your Web server using an access list.
      • authentication: This sets the authentication for login to the Web server to either local, enable, or tacacs.
      • path: This establishes the root path where the Web server begins looking for files.
      • port: This allows you to change the port number for the Web server from 80 to another port.
      • server: This enables and disables the Web server.
      • secure-server: This enables and disables the SSL Web server.
              

      Let’s check the new root folder for the HTTP server:
         
      DSw1#show ip http server status
      HTTP server status: Enabled
      HTTP server port: 80
      HTTP server authentication method: local
      HTTP server access class: 0
      HTTP server base path: flash:/
      HTTP server help root:
      Maximum number of concurrent server connections allowed: 16
      Server idle time-out: 180 seconds
      Server life time-out: 180 seconds
      Maximum number of requests allowed on a connection: 25
      HTTP server active session modules: ALL
      HTTP secure server capability: Present
      HTTP secure server status: Enabled
      HTTP secure server port: 443
      HTTP secure server ciphersuite: 3des-ede-cbc-sha des-cbc-sha rc4-128-md5 rc4-128-sha
      HTTP secure server client authentication: Disabled
      HTTP secure server trustpoint:
      HTTP secure server active session modules: ALL


      Now open your browser, and type:

      http://<your_router_or_switch_ip_address>

      03

      you will be prompted for a local user and password, and you should get you web page shown:
          02

      Based On: http://www.techrepublic.com/article/take-advantage-of-the-cisco-ios-web-server-on-your-router/

      Wednesday, August 19, 2015

      Cisco - DMVPN Explained + GNS3 Lab

      DMVPN (dynamic multipoint virtual private network) is a design approach that allows full mesh connectivity with the use of multipoint GRE tunnels. DMVPN itself is not a protocol but rather it is a design approach that consists of the following technologies:

      1. NHRP (next-hop resolution protocol)
      2. mGRE(multipoint GRE)
      3. Routing protocol
      4. IP sec encryption (optional)

      Most of these technologies are familiar to networking professionals, except for the NHRP protocol. NHRP is a resolution protocol that behaves like ARP. In an NHRP environment, there are two roles, the NHS (next-hop server) and the NHC (next-hop client). The NHCs register themselves with the NHS and provide information, such as their logical VPN IP addresses and the physical NBMA mapping. The NHCs also request information from the NHS about how to reach the other NHCs by learning the logical IP to NBMA mapping information. NHRP was used before in the legacy overlay VPN environment particularly in building frame-relay SVCs (switched virtual circuits). Today the protocol is used in the DMVPN environment as well using the same behavior.

      DMVPN is typically deployed using MPLS and Internet services because DMVPN has the capability to build dynamic tunnels to other spokes or branches without going through the hub site. This makes efficient use of the full mesh topologies mentioned above. If DMVPN is deployed using the Internet, the hub router requires a static public IP address as this will be configured in the NHC routers as the NHS IP address. The spokes don’t require a static public IP address as a tunnel source because they will report their physical IP to logical mappings to the NHS or the hub. In an MPLS environment, using the IP address of the Loopback is an acceptable design. DMVPN provides zero-touch configuration on the hub router if a new spoke is added.

      DMVPN has so far three phases of evolution: Phase 1 had only hub-and-spoke, in Phase 2 direct spoke-to-spoke capability for DMVPN was added, and Phase 3 has features that help a hierarchical DMVPN design scale better through the use of NHRP Shortcut and other enhancements. Our lab will focus on more on Phase 2.

      In this GNS3 Lab, we will have the following tasks below. Verification will be done for each of the steps.

      1. Configure DMVPN on the hub router R1.
      2. Configure spokes R2, R3 and R4.
      3. Configure EIGRP as the routing protocol and enable spoke-to-spoke tunnels. Add Loopback10 to each of the routers and announce it in EIGRP.
      4. Configure encryption.

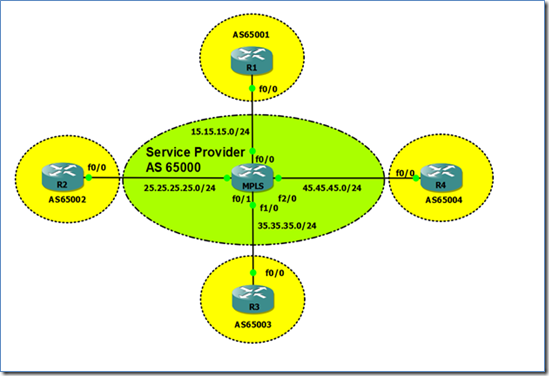
      Below are the physical and logical diagrams.

      clip_image001

      Figure 1. Network Topology

      clip_image002

      Figure 2. DMVPN Topology


      Task 1: Configure DMVPN on the Hub Router R1

      The MPLS router in the GNS3 topology has already been pre-configured to peer with all the routers using BGP. The routers in this topology are already announcing their Loopback0s through BGP. Before proceeding with the configuration, let’s check if we can see the loopback IP addresses of all the routers from R1.

      R1#sh ip bgp
      BGP table version is 5, local router ID is 1.1.1.1
      Status codes: s suppressed, d damped, h history, * valid, > best, i - internal,
      r RIB-failure, S Stale
      Origin codes: i - IGP, e - EGP, ? - incomplete

      Network Next Hop Metric LocPrf Weight Path
      *> 1.1.1.1/32 0.0.0.0 0 32768 i
      *> 2.2.2.2/32 15.15.15.5 0 65000 65002 i
      *> 3.3.3.3/32 15.15.15.5 0 65000 65003 i
      *> 4.4.4.4/32 15.15.15.5 0 65000 65004 i


      Then we configure Tunnel100 with the DMVPN configuration for hub routers.

      R1(config)#int tun100
      R1(config-if)#ip add 10.1.1.1 255.255.255.0
      R1(config-if)#ip nhrp map multicast dynamic
      R1(config-if)#ip nhrp authentication cisco
      R1(config-if)#ip nhrp network-id 100
      R1(config-if)#tunnel source Loopback0
      R1(config-if)#tunnel mode gre multipoint
      R1(config-if)#tunnel key 100


      Let’s break down the commands one by one.

      • ip nhrp map multicast dynamic: Normally this is configured in the hub routers to allow NHRP to automatically add routers to the multicast NHRP mappings so a static mapping is not required any more for each of the spokes. This command also enables routing protocols to work over the mGRE.
      • ip nhrp authentication <string>: This is an optional command. All the routers with NHRP within the same DMVPN network must have the same string or password.
      • ip nhrp network-id <number>: This is a required command to start NHRP. All routers in the same NHRP network should have the same network-id. This can also be used along with the “tunnel key” command to segregate different DMVPN networks using the same interface/ IP address as the tunnel source.
      • tunnel source Loopback0: This is the “physical” or real IP address which the tunnel should be sourced from. In the typical GRE configuration, a tunnel destination is required, but in DMVPN the tunnel destination is resolved through NHRP.
      • tunnel mode gre multipoint: Sets the GRE tunnel to behave as a multipoint tunnel.
      • tunnel key <number>” Like “ip nhrp network-id,” this allows separation of DMVPN networks using the same interface/ IP address as the source of the tunnel. This was mandatory in the previous IOS versions but, for the most recent ones, the DMVPN tunnel can come up without this command.


      Task 2: Configure Spokes R2, R3 and R4

      Let’s proceed to configure DMVPN on the spokes and explain each command later. The spokes will have a different command set than that of the hub.

      R2(config)#interface Tunnel100
      R2(config-if)# ip address 10.1.1.2 255.255.255.0
      R2(config-if)# ip nhrp map multicast 1.1.1.1
      R2(config-if)# ip nhrp map 10.1.1.1 1.1.1.1
      R2(config-if)# ip nhrp nhs 10.1.1.1
      R2(config-if)# ip nhrp network-id 100
      R2(config-if)# ip nhrp registration timeout 60
      R2(config-if)# ip nhrp holdtime 120
      R2(config-if)# ip nhrp authentication cisco
      R2(config-if)# tunnel source Loopback0
      R2(config-if)# tunnel mode gre multipoint
      R2(config-if)# tunnel key 100


      R3(config)#interface Tunnel100
      R3(config-if)# ip address 10.1.1.3 255.255.255.0
      R3(config-if)# ip nhrp map multicast 1.1.1.1
      R3(config-if)# ip nhrp map 10.1.1.1 1.1.1.1
      R3(config-if)# ip nhrp nhs 10.1.1.1
      R3(config-if)# ip nhrp network-id 100
      R3(config-if)# ip nhrp registration timeout 60
      R3(config-if)# ip nhrp holdtime 120
      R3(config-if)# ip nhrp authentication cisco
      R3(config-if)# tunnel source Loopback0
      R3(config-if)# tunnel mode gre multipoint
      R3(config-if)# tunnel key 100


      R4(config)#interface Tunnel100
      R4(config-if)# ip address 10.1.1.4 255.255.255.0
      R4(config-if)# ip nhrp map multicast 1.1.1.1
      R4(config-if)# ip nhrp map 10.1.1.1 1.1.1.1
      R4(config-if)# ip nhrp nhs 10.1.1.1
      R4(config-if)# ip nhrp network-id 100
      R4(config-if)# ip nhrp registration timeout 60
      R4(config-if)# ip nhrp holdtime 120
      R4(config-if)# ip nhrp authentication cisco
      R4(config-if)# tunnel source Loopback0
      R4(config-if)# tunnel mode gre multipoint
      R4(config-if)# tunnel key 100

      Let’s break down and discuss each of the commands.

      • ip nhrp map multicast <1.1.1.1>: To put it simply, this command adds the NBMA address, in our case the loopback address of R1, to be a recipient of multicast/broadcast traffic coming from this spoke. The source IP address of the hub router’s DMVPN tunnel is configured as well as the other hub IP address if the design should go for multiple hubs.
      • ip nhrp map <10.1.1.1> <1.1.1.1>: To put it simply, this command states that 1.1.1.1 is the NBMA or real IP address of R1’s tunnel IP address of 10.1.1.1.
      • ip nhrp nhs <10.1.1.1>: This basically tells the router that the NHS is 10.1.1.1. This is the tunnel IP address of the hub router R1 in our example. The router will know who to consult to if it wishes to form a spoke-to-spoke tunnel. Multiple NHS configurations can be made if there are multiple hubs in the DMVPN network.

      The rest of the NHRP commands are self-explanatory. The network-id and tunnel key in the spokes should match what is configured in the hub router.


      Task 3: Configure EIGRP as the routing protocol and enable spoke-to-spoke tunnels. Add Loopback10 to each of the routers and announce it in EIGRP.

      Let’s enable EIGRP and announce the DMVPN network. Any routing protocol can be used, but EIGRP or OSPF are favorable in most designs. One thing to look out for is that for DMVPN spoke-to-spoke to work and bypass the hub, the next-hop IP address of the route should be unchanged, meaning it should not be the IP address of the hub’s tunnel but should be the corresponding spoke tunnel IP address. In OSPF, changing the interface network type to “broadcast” is the solution. EIGRP requires split-horizon to be disabled and next-hop-self on the hub router.

      R1(config-if)#interface Loopback10
      R1(config-if)#ip address 11.11.11.11 255.255.255.255
      !
      R1(config)#router eigrp 100
      R1(config-router)#no auto-summary
      R1(config-router)#network 10.1.1.0 0.0.0.255
      R1(config-router)#network 11.11.11.11 0.0.0.0.
      !
      R1(config-if)#int tun100
      R1(config-if)#no ip split-horizon eigrp 100
      R1(config-if)#no ip next-hop-self eigrp 100


      R2(config)#int lo10
      R2(config-if)#ip address 22.22.22.22 255.255.255.255
      !
      R2(config-if)#router eigrp 100
      R2(config-router)#network 10.1.1.0 0.0.0.255
      R2(config-router)#network 22.22.22.22 0.0.0.0


      R3(config-if)#int l10
      R3(config-router)#network 10.1.1.0 0.0.0.255
      R3(config-if)#ip address 33.33.33.33 255.255.255.255
      !
      R3(config-if)#router eigrp 100
      R3(config-router)#network 33.33.33.33 0.0.0.0


      R4(config-if)#int l10
      R4(config-router)#network 10.1.1.0 0.0.0.255
      R4(config-if)#ip address 44.44.44.44 255.255.255.255
      !
      R4(config-if)#router eigrp 100
      R4(config-router)#network 44.44.44.44 0.0.0.0


      Let’s check and verify EIGRP neighbor adjacencies and routes:

      R1#sh ip eigrp ne
      IP-EIGRP neighbors for process 100
      H Address Interface Hold Uptime SRTT RTO Q Seq
      (sec) (ms) Cnt Num
      2 10.1.1.4 Tu100 14 00:03:18 79 474 0 7
      1 10.1.1.3 Tu100 12 00:04:42 76 456 0 6
      0 10.1.1.2 Tu100 14 00:04:42 66 396 0 5

      R1#sh ip route eigrp
      33.0.0.0/32 is subnetted, 1 subnets
      D 33.33.33.33 [90/14208000] via 10.1.1.3, 00:01:24, Tunnel100
      22.0.0.0/32 is subnetted, 1 subnets
      D 22.22.22.22 [90/14208000] via 10.1.1.2, 00:02:58, Tunnel100
      44.0.0.0/32 is subnetted, 1 subnets
      D 44.44.44.44 [90/14208000] via 10.1.1.4, 00:00:44, Tunnel100

      Let’s check how many NHRP entries before we ping 44.44.44.44 from R2, using 22.22.22.22 as source. We will only see one static mapping which is going to R1, the NHS.

      R2#sh ip nhrp
      10.1.1.1/32 via 10.1.1.1, Tunnel100 created 00:12:55, never expire
      Type: static, Flags: authoritative used
      NBMA address: 1.1.1.1

      We will now test if spoke-to-spoke is possible. Let’s trace from R2 to R4. Take note that in some cases the trace will go to R1 for the initial traffic. The succeeding packets will go directly to R4. The reason for this is that. when the initial traffic is sent, R2 is still in the process of getting information about how to reach R4 directly through NHRP.

      R2#traceroute 44.44.44.44 source 22.22.22.22
      Type escape sequence to abort.
      Tracing the route to 44.44.44.44

      1 10.1.1.4 36 msec 36 msec 36 msec

      R2#sh ip route 44.44.44.44
      Routing entry for 44.44.44.44/32
      Known via "eigrp 100", distance 90, metric 27008000, type internal
      Redistributing via eigrp 100
      Last update from 10.1.1.4 on Tunnel100, 00:02:20 ago
      Routing Descriptor Blocks:
      * 10.1.1.4, from 10.1.1.1, 00:02:20 ago, via Tunnel100
      Route metric is 27008000, traffic share count is 1
      Total delay is 1005000 microseconds, minimum bandwidth is 2000 Kbit
      Reliability 255/255, minimum MTU 1200 bytes
      Loading 1/255, Hops 2

      R2#sh ip nhrp
      10.1.1.1/32 via 10.1.1.1, Tunnel100 created 00:14:45, never expire
      Type: static, Flags: authoritative used
      NBMA address: 1.1.1.1
      10.1.1.4/32 via 10.1.1.4, Tunnel100 created 00:00:04, expire 00:01:14
      Type: dynamic, Flags: router used
      NBMA address: 4.4.4.4

      The traceroute above shows that the path taken was directly to the tunnel IP address of R4. The “show ip nhrp” command showed as well that the R2 built a direct spoke-to-spoke to R4 and traffic did not pass through R1.


      Task 4: Configure Encryption

      A good network design includes a way to secure traffic. This is a must, given that DMVPN is deployed into shared topologies like internet and MPLS. Let’s proceed to configure IP sec encryption. We will begin with configuration of the IP sec policy, SA, and profiles.

      On All Routers:

      crypto isakmp policy 5
      encr aes 256
      group 2
      authentication pre-share
      !
      crypto isakmp key 0 cisco address 0.0.0.0 0.0.0.0
      !
      crypto isakmp invalid-spi-recovery
      crypto isakmp keepalive 10
      !
      crypto ipsec security-association lifetime kilobytes 536870912
      crypto ipsec security-association replay disable
      !
      crypto ipsec transform-set DMVPN esp-aes 256 esp-sha-hmac comp-lzs
      crypto ipsec df-bit clear
      !
      crypto ipsec profile DMVPN
      set transform-set DMVPN

      Then let’s apply the crypto IP sec profile as tunnel protection mode on the tunnels for each router.

      R1(ipsec-profile)#int Tunnel100
      R1(config-if)# tunnel protection ipsec profile DMVPN
      R1(config-if)#end

      R1#
      *Mar 1 00:25:45.115: %CRYPTO-6-ISAKMP_ON_OFF: ISAKMP is ON
      *Mar 1 00:25:45.191: %SYS-5-CONFIG_I: Configured from console by console
      R1#
      *Mar 1 00:25:45.731: %CRYPTO-4-RECVD_PKT_NOT_IPSEC: Rec'd packet not an IPSEC packet.
      (ip) vrf/dest_addr= /1.1.1.1, src_addr= 2.2.2.2, prot= 47


      R2(ipsec-profile)#int Tunnel100
      R2(config-if)# tunnel protection ipsec profile DMVPN


      R3(ipsec-profile)#int Tunnel100
      R3(config-if)# tunnel protection ipsec profile DMVPN


      R4(config)#int Tunnel100
      R4(config-if)# tunnel protection ipsec profile DMVPN

      The network adjacencies will be lost and will only recover until the configurations are complete for each router. Now, let’s verify if traffic is encrypted and network connectivity is still up.

      R1#ping 22.22.22.22 source 11.11.11.11
      Type escape sequence to abort.
      Sending 5, 100-byte ICMP Echos to 22.22.22.22, timeout is 2 seconds:
      Packet sent with a source address of 11.11.11.11
      !!!!!
      Success rate is 100 percent (5/5), round-trip min/avg/max = 52/62/76 ms

      R1#ping 33.33.33.33 source 11.11.11.11
      Type escape sequence to abort.
      Sending 5, 100-byte ICMP Echos to 33.33.33.33, timeout is 2 seconds:
      Packet sent with a source address of 11.11.11.11
      !!!!!
      Success rate is 100 percent (5/5), round-trip min/avg/max = 40/52/64 ms

      R1#ping 44.44.44.44 source 11.11.11.11
      Type escape sequence to abort.
      Sending 5, 100-byte ICMP Echos to 44.44.44.44, timeout is 2 seconds:
      Packet sent with a source address of 11.11.11.11
      !!!!!
      Success rate is 100 percent (5/5), round-trip min/avg/max = 64/80/100 ms

      R1#sh crypto isakmp sa
      dst src state conn-id slot status
      1.1.1.1 3.3.3.3 QM_IDLE 2 0 ACTIVE
      1.1.1.1 2.2.2.2 QM_IDLE 1 0 ACTIVE
      1.1.1.1 4.4.4.4 QM_IDLE 3 0 ACTIVE

      The “QM_IDLE” means that IP sec is working properly. EIGRP adjacencies are restored. Now we have successfully created a secure and encrypted DMVPN network.

      References


      Based On:

      Tuesday, May 5, 2015

      Cisco / Linux - Decapsulating Cisco ERSPAN With Linux

      Decapsulation ERSPAN Traffic With Open Source Tools

      Posted on May 3, 2015 by Radovan Brezula

      Cisco Encapsulated Remote SPAN (ERSPAN) feature allows to monitor traffic on one or more ports and send the monitored traffic to one or more destination ports.  Traffic is encapsulated into GRE tunnel and routed via network to ERSPAN destination. Any device that supports ERSPAN can be used as ERSPAN destination. It might be another Cisco device or Linux with installed software that can decapsulate GRE traffic.

      The goal of this article is to show methods and tools for decapsulation of  ERSPAN traffic. For this purpose I have built simple lab that consists of a Cisco CSR 1000v router and two Linux boxes. Core Linux represents a network host and generates network traffic (ICMP) that is going to be monitored. It is connected to the port GigabitEthernet1 of the Cisco router. The router is configured to monitor traffic on the port Gi1 and it sends traffic encapsulated in GRE tunneling protocol to IP address 10.230.10.1. It is the IP address of the ERSPAN destination configured on Linux  Security Union. Security Onion is a unique Linux distro for intrusion detection, network security monitoring, and log management based on Ubuntu however any other Linux distro can be used.

      clip_image001

      Picture 1 - ERSPAN Lab Topology

      Below is an example of ERSPAN configuration on the CSR 1000v router. This is the source ERSPAN type and with configured rspan_id 1. The interface Gi1 is being monitored and the GRE traffic is sent to ERSPAN destination address IP 10.230.10.1.

      CSR1000v# show running-config | b monitor
      monitor session 1 type erspan-source
      description ERSPAN to 10.230.10.1
      source interface Gi1
      destination
      erspan-id 1
      mtu 1464
      ip address 10.230.10.1
      origin ip address 10.230.10.2

      Capturing ERSPAN Traffic with Wireshark

      We are going to capture and analyze ERSPAN traffic with Wireshark packet sniffer. First configure IP address 10.230.10.1 on interface eth1 of the Linux Security Onion.

      janosik@onion:~$ sudo su
      root@onion# ip address add 10.230.10.1/24 dev eth1

      Now use Wireshark to capture GRE traffic on Security Onion on its interface eth1 and ping the router IP address 192.168.1.2 from the Linux Core host (IP 192.168.1.1). If the source ERSPAN is properly configured on router, packets from the subnet 192.168.1.0/24 should appear in Wireshark output.

      A closer look at the picture below reveals that the original packet ICMP packet (MAC header, IPv4 header and ICMP header) is now encapsulated as following.

      MAC header + IPv4 header (10.230.10.2, 10.230.10.1) + GRE header (Protocol type ERSPAN) + ERPAN header + (original packet)

      clip_image002

      Picture 2 - Encapsulated GRE Traffic Captured on Interface Eth1

      An original ICMP packet is encapsulated into GRE tunnel and the new outer MAC and IPv4 + GRE + ERSPAN headers are added to original packets. It allows encapsulated traffic to be forwarded through network to ERSPAN destination. However if we want software application such as IPS/IDS to analyze encapsulated packets, the outer L2 and L3 headers must be striped from packet. This can be done with tools such as RCDCAP  which dissects packets from GRE tunnel.


      Configuring GRE tunnel on ERSPAN Destination Device

      If for some reason we do not want to install special software that dissects packets from GRE tunnel we can configure GRE tunnel on ERSPAN destination (Linux Security Onion) and let IDS to listen on a tunneled interface. Thanks to this configuration the outer MAC and IPv4 headers are stripped and do no appear in Wireshark output.

      a) Load gre module to kernel

      janosik@onion:~$ sudo su
      root@onion# modprobe ip_gre

      b) Choose receiving interface and assign IPv4 to it

      root@onion# ip addr add 10.230.10.1/24 dev eth1

      Set the MTU of the network interface that receives GRE packets larger than 1500 e.g. to 1900.  Otherwise we are going to miss some bytes in larger packets.

      root@onion# ip link set dev eth1 mtu 1900

      c) Create virtual tunnel interface and associate it with IP previously configured on eth1 interface

      root@onion# ip tunnel add mon0 mode gre local 10.230.10.1 ttl 8

      d) Add IP address to interface mon0 which is not used for anything

      root@onion# ip addr add 1.1.1.1/30 dev mon0

      e) Change the state of mon0 device to up

      root@onion# ip link set mon0 up

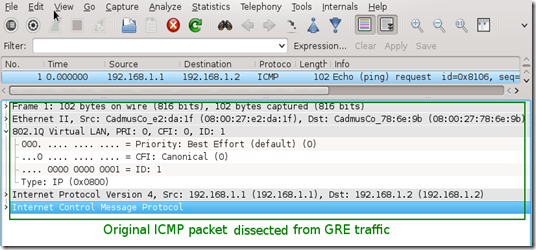
      Again, generate some traffic in the subnet 192.168.1.0/24 and configure Wireshark to listen on interface mon0. Notice that the outer MAC and Ipv4 header are now stripped from the ICMP packet.

      clip_image003

      Picture 3 - Decapsulated Traffic Captured on Interface Eth1

      Using RCDCAP for Decapsulating ERSPAN Traffic

      RCDCAP is wrapper program that dissects the traffic and creates a virtual interface where the traffic is already decapsulated. I've compiled it from the source and created the Ubuntu package RCDCap-0.7.99-Linux for Ubuntu 15.04. Be aware that additional packages are needed to get it working.

      janosik@onion:~$ sudo su
      root@onion# apt-get install libboost-regex1.55.0

      Use apt-get to install the packages below. If they are not available in a repository  download them from here and install manually with dpkg -i command.

      • libboost-program-options1.48.0_1.48.0-3_amd64.deb
      • libboost-thread1.48.0_1.48.0-3_amd64.deb
      • libboost-system1.48.0_1.48.0-3_amd64.deb

      root@onion# dpkg -i libboost-program-options1.48.0_1.48.0-3_amd64.deb libboost-thread1.48.0_1.48.0-3_amd64.deb libboost-system1.48.0_1.48.0-3_amd64.deb

      Now we can install RCDCAP with the command.

      root@onion# dpkg -i RCDCap-0.7.99-Linux.deb

      Once RCDCAP is installed configure interface eth1 to prepare for capturing.

      janosik@onion:~$ sudo su
      root@onion# ip addr add dev eth1 10.230.10.1/24
      root@onion# ip link set dev eth1 mtu 1900
      root@onion# ip link set dev eth1 up

      Start RCDCAP with the command below and let Wireshark to listen on interface mon1.

      root@onion# rcdcap -i eth1 --erspan --tap-persist --tap-device mon1 --expression "host 10.230.10.1"

      We can see that RCDCAP have dissected monitored traffic from GRE and only original MAC + IPv4 + ICMP headers and pyaload are presented in Wireshark output.

      clip_image004

      Picture 4 - Decapsulated Traffic Captured on Interface Mon1

      Reference:

      Taken From: http://brezular.com/2015/05/03/decapsulation-erspan-traffic-with-open-source-tools/

      Sunday, March 29, 2015

      Cisco – Router as a DNS Server

      As many didn’t know (me included) you can configure cisco router as DNS server.

      A cisco router can:

      • Reply to requests for locally defined DNS entries.
      • Forward the request the public DNS servers (max 6)

      In the cenario bellow we are going setup and test this.

      Topology2


      Configs

      -- R1 --

      interface FastEthernet0/0
      description *** LAN ***
      ip address 192.168.1.254 255.255.255.0
      no shutdown

      interface FastEthernet0/1
      description *** WAN ***
      ip address 200.0.0.2 255.255.255.252
      no shutdown
       
      ip route 0.0.0.0 0.0.0.0 200.0.0.1 name DefaultRoute
       
      !!!!!!!!!!!!!!!!!!!!!!!!!!!!!!!!!!!!!!!!!!!!!!!!!!!!!!!!!!!!!!!!!!!!
      ! Enable the router as a DNS server
      ! and domain lookup on the router
      !!!!!!!!!!!!!!!!!!!!!!!!!!!!!!!!!!!!!!!!!!!!!!!!!!!!!!!!!!!!!!!!!!!!
      ip dns server
      ip domain-lookup

      !!!!!!!!!!!!!!!!!!!!!!!!!!!!!!!!!!!!!!!!!!!!!!!!!!!!!!!!!!!!!!!!!!!!
      ! Public name-servers, for the router to query
      ! the names it doesn't know
      ! Maximum 6x DNS servers
      !!!!!!!!!!!!!!!!!!!!!!!!!!!!!!!!!!!!!!!!!!!!!!!!!!!!!!!!!!!!!!!!!!!!
      ip name-server 4.2.2.5
      ip name-server 4.2.2.6

      !!!!!!!!!!!!!!!!!!!!!!!!!!!!!!!!!!!!!!!!!!!!!!!!!!!!!!!!!!!!!!!!!!!!
      ! Local DNS Entries
      !!!!!!!!!!!!!!!!!!!!!!!!!!!!!!!!!!!!!!!!!!!!!!!!!!!!!!!!!!!!!!!!!!!!
      ip host PC1 192.168.1.1
      ip host PC2 192.168.1.2
      ip host PC3 192.168.1.3

      The big secret here is the “ip dns server”, because the rest of the config you could have it to solve name locally on the router.

      With the “ip dns server” you extend the router’s local name resolution, to the hosts on the network.


      -- PC1 --

      PCx

      The PCs on my topology are actually routers so here is my config:

      -- PC1 (Router) --
      interface FastEthernet0/0
      ip address 192.168.1.1 255.255.255.0
      no shutdown

      ip route 0.0.0.0 0.0.0.0 192.168.1.254 name GW

      ip domain-lookup
      ip name-server 192.168.1.254


      -- PC2 (Router) --
      interface FastEthernet0/0
      ip address 192.168.1.2 255.255.255.0
      no shutdown
       
      ip route 0.0.0.0 0.0.0.0 192.168.1.254 name GW

      ip domain-lookup
      ip name-server 192.168.1.254


      -- PC3 (Router) --
      interface FastEthernet0/0
      ip address 192.168.1.3 255.255.255.0
      no shutdown

      ip route 0.0.0.0 0.0.0.0 192.168.1.254 name GW

      ip domain-lookup
      ip name-server 192.168.1.254


      Tests

      -- Test the Local Entries for The PCs on the LAN --

      PC1#ping PC2
      Translating "PC2"...domain server (192.168.1.254) [OK]

      Type escape sequence to abort.
      Sending 5, 100-byte ICMP Echos to 192.168.1.2, timeout is 2 seconds:
      .!!!!
      Success rate is 80 percent (4/5), round-trip min/avg/max = 1/1/1 ms

      PC1#ping PC3
      Translating "PC3"...domain server (192.168.1.254) [OK]

      Type escape sequence to abort.
      Sending 5, 100-byte ICMP Echos to 192.168.1.3, timeout is 2 seconds:
      !!!!!
      Success rate is 100 percent (5/5), round-trip min/avg/max = 1/1/5 ms
      PC1#

      -- Test Forwarding Request to Public DNS Servers--

      PC1#ping www.google.com

      Translating "www.google.com"...domain server (192.168.1.254) [OK]

      Type escape sequence to abort.
      Sending 5, 100-byte ICMP Echos to 216.58.208.4, timeout is 2 seconds:
      !!!!!
      Success rate is 100 percent (5/5), round-trip min/avg/max = 52/69/84 ms


      Related Links: