Sunday, November 1, 2015

Cisco - Port Mirror (SPAN / RSPAN / ERSPAN)

Introduction:

Switch port Analyzer (SPAN) is an efficient, high performance traffic monitoring system. It duplicated network traffic to one or more monitor interfaces as it transverse the switch. SPAN is used for troubleshooting connectivity issues and calculating network utilization and performance, among many others. There are three types of SPANs supported on Cisco products, which are illustrated in below diagram.

Types of SPAN:

SPAN1.jpgSPAN2.pngSPAN3.jpg

SPAN

SPAN1.jpg

Local SPAN: Mirrors traffic from one or more interface on the switch to one or more interfaces on the same switch.
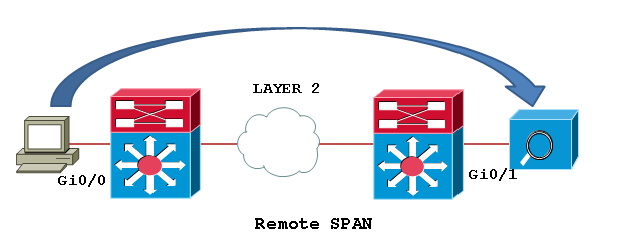
Remote SPAN (RSPAN): An extension of SPAN called remote SPAN or RSPAN. RSPAN allows you to monitor traffic from source ports distributed over multiple switches, which means that you can centralize your network capture devices. RSPAN works by mirroring the traffic from the source ports of an RSPAN session onto a VLAN that is dedicated for the RSPAN session. This VLAN is then trunked to other switches, allowing the RSPAN session traffic to be transported across multiple switches. On the switch that contains the destination port for the session, traffic from the RSPAN session VLAN is simply mirrored out the destination port.
Encapsulated remote SPAN (ERSPAN): encapsulated Remote SPAN (ERSPAN), as the name says, brings generic routing encapsulation (GRE) for all captured traffic and allows it to be extended across Layer 3 domains.

ERSPAN is a Cisco proprietary feature and is available only to Catalyst 6500, 7600, Nexus, and ASR 1000 platforms to date. The ASR 1000 supports ERSPAN source (monitoring) only on Fast Ethernet, Gigabit Ethernet, and port-channel interfaces.

Configuration Example:
Configuring Local SPAN: Local SPAN configures using “monitor session” command specifying source and destination on the same switch.

Switch1# configure terminal
Switch1(config)# monitor session 1 source interface fastEthernet0/2
Switch1(config)# monitor session 1 destination interface fastEthernet0/24
Switch1(config)#end

Local SPAN configuration syntax on Cisco IOS release 12.2(33)SXH and beyond as shown below.

monitor session 1 type local
source int fa0/2
destination int fa0/24


RSPAN

SPAN2.png

Step1: In order to configure RSPAN you need to have an RSPAN VLAN, those VLANs have special properties and can’t be assigned to any access ports. To create a VLAN for RSPAN on Cisco IOS, you must create the VLAN via the config-vlan configuration mode, as opposed to using the older VLAN database configuration mode. During the process of defining VLAN parameters, you must specify that the new VLAN is an RSPAN VLAN by configuring the remote-span VLAN configuration command.

Switch1# configure terminal
Switch1(config)# vlan 200
Switch1(config-vlan)# remote-span
Switch1(config-vlan)# end
Switch1# show vlan remote-span

Switch2# configure terminal
Switch2(config)# vlan 200
Switch2(config-vlan)# remote-span
Switch2(config-vlan)# end
Switch2# show vlan remote-span
Remote SPAN VLANs

Step2: Then configure the RSPAN on Source switch: Unlike SPAN, where the source and destination ports exist on the same switch, the source and destination ports for an RSPAN session reside on different switches. This requires a separate RSPAN source session to be configured, as well as a separate RSPAN destination session to be configured.

Switch1# configure terminal
Switch1(config)# monitor session 1 source interface fastEthernet0/2 rx
Switch1(config)# monitor session 1 destination remote vlan 200
reflector-port fastEthernet0/24
Switch1(config)# exit

Switch1# show monitor
Session 1
---------
Type                 : Remote Source Session
Source Ports     :
   Rx                 : Fa0/2
Reflector Port    : Fa0/24
Dest RSPAN VLAN  : 200

Step3: Configure the RSPAN on destination switch:
Switch2# configure terminal
Switch2(config)# monitor session 1 source remote vlan 200
Switch2(config)# monitor session 1 destination interface fastEthernet0/3
Switch2(config)# exit

The RSPAN VLAN should be allowed in ALL trunks between the involved switches (Source and Destination switches in this case); if you have enabled "pruning" in your network, remove the RSPAN VLAN from the pruning, with the command: “switchport trunk pruning vlan remove <RSPAN VLAN ID>” under the interface configure as trunk.

ERSPAN

SPAN3.jpg

In this example we will capture received traffic on the ASR 1002 (GigabitEthernet0/1/0) and send to Catalyst 6509 Gig2/2/1. This traffic will simply be captured, encapsulated in GRE by ASR 1002 natively by the QFP chipset and routed over to the Catalyst 6509. A sniffing station on the 6500 attached to GE2/2/1 will see the complete Ethernet frame (L2 to L7) information.
Configuring source interface, direction of traffic, and ERSPAN session ID on the ASR 1002.

ASR1002(config)# monitor session 1 type erspan-source
ASR1002(config-mon-erspan-src)# source interface gig0/1/0 rx
ASR1002(config-mon-erspan-src)# no shutdown
ASR1002(config-mon-erspan-src)# destination
ASR1002(config-mon-erspan-src-dst)# erspan-id 101
ASR1002(config-mon-erspan-src-dst)# ip address 10.1.1.1
ASR1002(config-mon-erspan-src-dst)# origin ip address 172.16.1.1

Configuring Catalyst 6509 to receive traffic from the source session on the ASR 1002

SW6509(config)# monitor session 2 type erspan-destination
SW6509(config-mon-erspan-dst)# destination interface gigabitEthernet2/2/1
SW6509(config-mon-erspan-dst)# no shutdown
SW6509(config-mon-erspan-dst)# source
SW6509(config-mon-erspan-dst-src)# erspan-id 101
SW6509(config-mon-erspan-dst-src)# ip address 10.1.1.1

You can use the show monitor session command to verify the configuration:

ASR1002#sh monitor session 1
Session 1
---------
Type                             : ERSPAN Source Session
Status                           : Admin Enabled
Source Ports                  :
RX Only                         : Gi0/1/0
Destination IP Address   : 10.1.1.1
MTU                              : 1464
Destination ERSPAN ID  : 101
Origin IP Address           : 172.16.1.1

To monitor the statistics of monitored traffic, you need to use "show platform hardware qfp active feature erspan state" command:

ASR1002#show platform hardware qfp active feature erspan state
ERSPAN State:
Status                : Active
Complexes         : 1
CPPs                 : 1
Capabilites          :
Max sessions      : 1024
Max outputs        : 128
Encaps type        : ERSPAN type-II
GRE protocol       : 0x88BE
MTU                    : 1464
IP TOS                : 0
IP TTL                 : 255
COS                   : 0
System Statistics:
DROP src session replica :                  0 /                 0
DROP term session replica:                 0 /                 0
DROP receive malformed   :                 0 /                 0
DROP receive invalid ID  :                    0 /                 0
DROP recycle queue full  :                   0 /                 0
DROP no GPM memory       :               0 /                 0
DROP no channel memory   :               0 /                 0
Client Debug Config:
Enabled: Info, Warn
Data Path Debug Config:
0x00000000
ASR1002#

Note:  10.1.1.1 is SW6509’s loopback. 172.16.1.1 Is ASR1002's loopback. ip address in destination session and ip address in source session should match. If they don't- that is causing the drops you see.

Taken From:

Friday, October 23, 2015

Linux - Schedule Tasks Using Crontab

Schedule Tasks on Linux Using Crontab

If you've got a website that's heavy on your web server, you might want to run some processes like generating thumbnails or enriching data in the background. This way it can not interfere with the user interface. Linux has a great program for this called cron. It allows tasks to be automatically run in the background at regular intervals. You could also use it to automatically create backups, synchronize files, schedule updates, and much more. Welcome to the wonderful world of crontab.


Crontab

The crontab (cron derives from chronos, Greek for time; tab stands fortable) command, found in Unix and Unix-like operating systems, is used to schedule commands to be executed periodically. To see what crontabs are currently running on your system, you can open a terminal and run:

$ sudo crontab -l

To edit the list of cronjobs you can run:

$ sudo crontab -e

This wil open a the default editor (could be vi or pico, if you want you canchange the default editor) to let us manipulate the crontab. If you save and exit the editor, all your cronjobs are saved into crontab. Cronjobs are written in the following format:

* * * * * /bin/execute/this/script.sh


Scheduling explained

As you can see there are 5 stars. The stars represent different date parts in the following order:

  • minute (from 0 to 59)
  • hour (from 0 to 23)
  • day of month (from 1 to 31)
  • month (from 1 to 12)
  • day of week (from 0 to 6) (0=Sunday)


Execute every minute

If you leave the star, or asterisk, it means every. Maybe that's a bit unclear. Let's use the the previous example again:

* * * * * /bin/execute/this/script.sh

They are all still asterisks! So this means execute /bin/execute/this/script.sh:

  • every minute
  • of every hour
  • of every day of the month
  • of every month
  • and every day in the week.

In short: This script is being executed every minute. Without exception.


Execute every Friday 1AM

So if we want to schedule the script to run at 1AM every Friday, we would need the following cronjob:

0 1 * * 5 /bin/execute/this/script.sh

Get it? The script is now being executed when the system clock hits:

  • minute: 0
  • of hour: 1
  • of day of month: * (every day of month)
  • of month: * (every month)
  • and weekday: 5 (=Friday)


Execute on workdays 1AM

So if we want to schedule the script to Monday till Friday at 1 AM, we would need the following cronjob:

0 1 * * 1-5 /bin/execute/this/script.sh

Get it? The script is now being executed when the system clock hits:

  • minute: 0
  • of hour: 1
  • of day of month: * (every day of month)
  • of month: * (every month)
  • and weekday: 1-5 (=Monday til Friday)


Execute 10 past after every hour on the 1st of every month

Here's another one, just for practicing

10 * 1 * * /bin/execute/this/script.sh

Fair enough, it takes some getting used to, but it offers great flexibility.


Neat scheduling tricks

What if you'd want to run something every 10 minutes? Well you could do this:

0,10,20,30,40,50 * * * * /bin/execute/this/script.sh

But crontab allows you to do this as well:

*/10 * * * * /bin/execute/this/script.sh

Which will do exactly the same. Can you do the the math? ; )


Special words

For the first (minute) field, you can also put in a keyword instead of a number:

  • @reboot Run once, at startup
  • @yearly Run once a year "0 0 1 1 *"
  • @annually (same as @yearly)
  • @monthly Run once a month "0 0 1 * *"
  • @weekly Run once a week "0 0 * * 0"
  • @daily Run once a day "0 0 * * *"
  • @midnight (same as @daily)
  • @hourly Run once an hour "0 * * * *"

Leaving the rest of the fields empty, this would be valid:

@daily /bin/execute/this/script.sh


Storing the crontab output

By default cron saves the output of /bin/execute/this/script.sh in the user's mailbox (root in this case). But it's prettier if the output is saved in a separate logfile. Here's how:

*/10 * * * * /bin/execute/this/script.sh >> /var/log/script_output.log 2>&1


Explained

Linux can report on different levels. There's standard output (STDOUT) and standard errors (STDERR). STDOUT is marked 1, STDERR is marked 2. So the following statement tells Linux to store STDERR in STDOUT as well, creating one datastream for messages & errors:

2>&1

Now that we have 1 output stream, we can pour it into a file. Where >will overwrite the file, >> will append to the file. In this case we'd like to to append:

>> /var/log/script_output.log


Mailing the crontab output

By default cron saves the output in the user's mailbox (root in this case) on the local system. But you can also configure crontab to forward all output to a real email address by starting your crontab with the following line:

MAILTO="yourname@yourdomain.com"


Mailing the crontab output of just one cronjob

If you'd rather receive only one cronjob's output in your mail, make sure this package is installed:

$ aptitude install mailx

And change the cronjob like this:

*/10 * * * * /bin/execute/this/script.sh 2>&1 | mail -s "Cronjob ouput" yourname@yourdomain.com


Trashing the crontab output

Now that's easy:

*/10 * * * * /bin/execute/this/script.sh > /dev/null 2>&1

Just pipe all the output to the null device, also known as the black hole. On Unix-like operating systems, /dev/null is a special file that discards all data written to it.


Caveats

Many scripts are tested in a BASH environment with the PATH variable set. This way it's possible your scripts work in your shell, but when run from cron (where the PATH variable is different), the script cannot find referenced executables, and fails.

It's not the job of the script to set PATH, it's the responsibility of the caller, so it can help to echo $PATH, and put PATH=<the result> at the top of your cron files (right below MAILTO).

Taken From: http://kvz.io/blog/2007/07/29/schedule-tasks-on-linux-using-crontab/

Sunday, October 18, 2015

Cisco - Dual WAN Internet with Failover (NAT & Routes)

In the past I had the need to implement failover between two connections to the Internet on the same router, at the time I implemented it using EEM Scripts which wasn’t the most elegant solution, so here I’m going to show you a  a better solution to do this.

Implementing the failover mechanism at first glance seems easier with one router than with two, but that is not the case, with two routers you can have them configured normally with the adition of VRRP/HSRP to do the failover between the routers.

With only one router you are going to have two aditional problems:

  • Changing the route from the primary to the secondary Internet access
  • Changing the NAT overload to the Interface towards the Secondary ISP / WAN (this was the part that I implemented with EEM scripts)

the first you can easily solve with a floating static route (secondary route) and a track / ip sla (to remove the primary route when the connectivity to the primary ISP is lost).

The second one is harder, you can have two NAT rules with two interfaces towards the two ISPs:

ip nat inside source 130 interface FastEthernet0/0 overload
ip nat inside source 131 interface FastEthernet1/0 overload

but selecting the one as the active one is the tricky part.

Even if the interface towards the primary ISP were to fail and become shutdown, the NAT rule remains active.

The cenario bellow has two different ISPs for for the WAN accesses, but its the sames as having two different connectivities via the same ISP (eg. Primary via Fiber Optic | Secondary via 4G)

Cenario

Logical View

TOP17

Fisical View

TOP18

You can download the lab fully implemented here:

it was implemented on GNS3 v1.2.1.


Configuration


PC1
====================================================

enable
conf t

hostname PC1

interface FastEthernet0/0
description *** Link to CPE1 ***
ip address 192.168.1.1 255.255.255.0
no shutdown

ip route 0.0.0.0 0.0.0.0 192.168.1.254 name DefaultGW
 
do write
 
 
CPE1
====================================================

enable
conf t

hostname CPE1

interface FastEthernet0/0
description *** Link to ISP1 ***
ip address 11.0.0.2 255.255.255.252
ip nat outside
no shutdown
 
interface FastEthernet0/1
description *** Link to ISP2 ***
ip address 22.0.0.2 255.255.255.252
ip nat outside
no shutdown
 
interface FastEthernet1/0
no switchport
description *** Link to PC1 ***
ip address 192.168.1.254 255.255.255.0
ip nat inside
no shutdown

 
!-- Select the Route - via ISP1 or ISP2 -------------------
!!!!!!!!!!!!!!!!!!!!!!!!!!!!!!!!!!!!!!!!!!!!!!!!!!!!!!!!!!!!!!!!!!!!!!!!!!!!!!!!!!!!!!!!!!!!!!!!
! The first route makes all the traffic flow via
! ISP1, but this is conditioned to track 10, that
! detects the  connectivity to ISP1.
! If track 10 fails the route is removed from the
! routing table.
!
!
! The second route has an higher administrative
! distance (worst), and as long as the first rule
! is available this rule is never inserted on
! the routing table (aka floating static route)
!
! If the first route disapears because the track
! failed then the second route is inserted in the
! routing table, and all traffic will flow via ISP2
!!!!!!!!!!!!!!!!!!!!!!!!!!!!!!!!!!!!!!!!!!!!!!!!!!!!!!!!!!!!!!!!!!!!!!!!!!!!!!!!!!!!!!!!!!!!!!!!

ip route 0.0.0.0 0.0.0.0 11.0.0.1 track 10 name Default-Primary
ip route 0.0.0.0 0.0.0.0 22.0.0.1 250 name Default-Secondary

ip sla 10
icmp-echo 11.0.0.1 source-interface FastEthernet0/0
frequency 5
ip sla schedule 10 life forever start-time now

track 10 ip sla 10 reachability
!show track brief
!show track 10


!-- Change the NAT Interface to Reflect the Active Route --
!!!!!!!!!!!!!!!!!!!!!!!!!!!!!!!!!!!!!!!!!!!!!!!!!!!!!!!!!!!!!!!!!!!!!!!!!!!!!!!!!!!!!!!!!!!!!!!!
! Changing the routes isn't enough, we also
! need to change the NAT rule, because each route
! implies a different exit interface.
!
! To select which NAT rule will be used for each
! route, we used route maps instead of an ACL
! to identify traffic (active the rule).
!
! These route maps match the LAN traffic, plus
! the current next hop to forward the traffic thus
! selecting the correct NAT rule for the current
! active route.
!!!!!!!!!!!!!!!!!!!!!!!!!!!!!!!!!!!!!!!!!!!!!!!!!!!!!!!!!!!!!!!!!!!!!!!!!!!!!!!!!!!!!!!!!!!!!!!!

ip nat inside source route-map RM-ISP1-PRIMARY interface FastEthernet0/0 overload
ip nat inside source route-map RM-ISP2-PRIMARY interface FastEthernet0/1 overload


access-list 130 remark *** Traffic for The Internet (NAT) ***
access-list 130 permit ip 192.168.1.0 0.0.0.255 any

route-map RM-ISP1-PRIMARY permit 10
match ip address 130
match interface FastEthernet0/0        !--> Match the exit interface of the route

route-map RM-ISP2-PRIMARY permit 10
match ip address 130
match interface FastEthernet0/1        !--> Match the exit interface of the route
!show route-map


!-- Simulate a Failure Along The Way ----------------------
!!!!!!!!!!!!!!!!!!!!!!!!!!!!!!!!!!!!!!!!!!!!!!!!!!!!!!!!!!!!!!!!!!!!!!!!!!!!!!!!!!!!!!!!!!!!!!!!
! To simulate the failure to see the topology
! changing to the secondary access, we are going
! to use a route to force the track/ip sla to fail.
!
! This route will force all the connectivity test
! traffic destined for ISP1(11.0.0.1) to go to NULL
! which is a black hole. Like this ISP1 will never
! get the icmp echos requests from the ip sla test
! or respond to it, thus simulating a connectivity
! failure towards ISP1
!
! NOTE: It takes a couple of seconds to change
!!!!!!!!!!!!!!!!!!!!!!!!!!!!!!!!!!!!!!!!!!!!!!!!!!!!!!!!!!!!!!!!!!!!!!!!!!!!!!!!!!!!!!!!!!!!!!!!

!-- Failure Sim + Debug/Tshoot --
do debug ip nat
ping 77.0.0.1
show ip route
!S*    0.0.0.0/0 [1/0] via 11.0.0.1

ip route 11.0.0.1 255.255.255.255 NULL0 name FailureSim

ping 77.0.0.1
show ip route
!S*    0.0.0.0/0 [250/0] via 22.0.0.1

! Both Pings will work but notice that the default
! route is diferent (diferent next hop)


!-- Restore to Normal Operation --
no ip route 11.0.0.1 255.255.255.255 NULL0 name FailureSim
do no debug all


ISP1-PRIMARY
====================================================

enable
conf t

hostname ISP1-PRIMARY

interface FastEthernet0/0
description *** Link to CPE1 ***
ip address 11.0.0.1 255.255.255.252
no shutdown

interface FastEthernet0/1
description *** Link to CPE2 ***
ip address 11.0.0.5 255.255.255.252
no shutdown
 
 
interface FastEthernet1/0
no switchport
description *** Link to ISP2 ***
ip address 22.0.0.6 255.255.255.252
no shutdown

    
ip route 77.0.0.0 255.255.255.248 11.0.0.6 name PublicIPs
ip route 22.0.0.0 255.255.255.252 22.0.0.5 name NatedLAN-viaIPS2

do write


ISP2-SECONDARY
====================================================

enable
conf t

hostname ISP2-SECONDARY

interface FastEthernet0/1
description *** Link to CPE1 ***
ip address 22.0.0.1 255.255.255.252
no shutdown
 
interface FastEthernet0/0
description *** Link to ISP1 ***
ip address 22.0.0.5 255.255.255.252
no shutdown

ip route 0.0.0.0 0.0.0.0 22.0.0.6 name Default
 
do write
 
 
CPE2
====================================================

enable
conf t

hostname CPE2

interface FastEthernet0/1
description *** Link to ISP1 ***
ip address 11.0.0.6 255.255.255.248
no shutdown
 
interface FastEthernet1/0
description *** Link to Internet Server ***
no switchport
ip address 77.0.0.6 255.255.255.248

ip route 0.0.0.0 0.0.0.0 11.0.0.5 name Default

do write


INTERNET SERVER
====================================================

enable
conf t

hostname INTERNET-SERVER

interface FastEthernet0/0
description *** Link to CPE1 ***
ip address 77.0.0.1 255.255.255.248
no shutdown
 
ip route 0.0.0.0 0.0.0.0 77.0.0.6 name Default

do write


Related Links